Join getAbstract to access the summary!
Join getAbstract to access the summary!
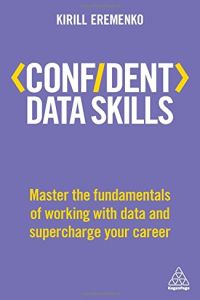
Kirill Eremenko
Confident Data Skills
Master the Fundamentals of Working with Data and Supercharge Your Career
Kogan Page, 2018
What's inside?
Data scientist Kirill Eremenko explains big data, algorithms, data analysis and careers in data.
Recommendation
Data scientist, entrepreneur and author Kirill Eremenko is enthusiastic about how data science can solve real-world problems, including in medicine and business. A former consultant and now CEO of the online educational portal SuperDataScience, he’s writing both for business leaders and for novice college grads investigating data science careers. Eremenko details the “Data Science Process” and explains algorithms in a way even readers with no technical background can understand. His clear manual will help anyone who wants to understand the processes and potential of data analytics.
Take-Aways
- You leave a “data exhaust” trail others can collect and analyze.
- Use the five-step “Data Science Process” as a structure for data analysis.
- 1. “Identify the question.” This is the linchpin of successful data analysis.
- 2. Clean the data. It takes time, but you can’t work with corrupt data.
- 3. Analyze your data. Select the most suitable type of algorithms.
- 4. Envision your data. Relay information visually to show what your analysis means.
- 5. Present your findings. Begin at the start of the analysis process and tell a story.
- Data science offers many career opportunities.
Summary
You leave a “data exhaust” trail others can collect and analyze.
Scientists define big data relative to current hardware and software. They base their definitions on the three “Vs”:
- Volume – In the billions of rows.
- Velocity – The speed of gathering data.
- Variety – The types of data included.
Museums, governments and companies all gathered data for years – in the form of hard copies – before the technology emerged to collect, store and analyze it. Data science relies on technology, but stories built of data nuggets are at its core, since data in whatever form tells the story of a culture. When you post on social media, drive past a security camera or shop online, you create “data exhaust” – the information used by data analytics. Businesses, governments and individual researchers have multiple ways to collect your data exhaust, an extremely important commodity. As The Economist reported in 2017, “Data has superseded oil as the world’s most valuable resource.”
Use the five-step “Data Science Process” as a structure for data analysis.
In the 1950s, British codebreaker Alan Turing developed a method for distinguishing between a human and a computer based on the responses to open-ended questions. No computer to date has passed the test. Futurist Raymond Kurzweil posits that by 2029, a computer will generate a seemingly human response that can fool the person administering the Turing test.
Today, the capacity of data analytics is increasing with the rapid pace of technological change. Amid this bewildering shifting landscape, users need a framework for carrying out successful data analysis projects. To this end, Joe Blitzstein and Hanspeter Pfister created the five-step Data Science Process, which calls for these measures:
1. “Identify the question.” This is the linchpin of successful data analysis.
Analysts must understand how the questions they ask affect their client company. You can redefine any queries after talking to your counterparts at the company, your colleagues, the organization’s leaders and subject area specialists to learn about the company, its industry and competitors. Participants must maintain this dialogue throughout the data analytics project.
Business leaders may present issues that data scientists can’t resolve because the leaders don’t frame their concerns as questions. For example, “We are under-delivering on product units” isn’t a query that’s open to data analysis; it’s the statement of a problem. A data scientist who understands the company and industry and who talks to the relevant leaders will be able to define questions relevant to addressing this problem. That definition is the crux of a successful data analysis project.
“Understanding not only what the problem is but also why it must be resolved now, who its key stakeholders are, and what it will mean for the institution…will help you to start refining your investigation.”
Conversations enable managers and data scientists to work together to define and polish the question and its sub-elements and to identify the available data and what it might reveal.
If the analysis requires more information, decide what data you lack. Is it quantitative – numerical or categorizable – or qualitative – non-numerical? Most corporate data is qualitative and, thus, more complex to analyze. Rapid developments in processing power enable more efficient algorithms to address this problem.
At this stage of the process, generate top-level visuals of the data set to identify trends that a program such as Tableau can analyze later. Depending on the quality of the data and the complexity of the issue, this might provide insight that will be helpful later in the process. Once you identify the necessary data and the questions to ask about it, present your findings to your client’s leaders and team members to identify any missing sub-questions and to further refine the project’s scope, timeline and milestones. Document the defined agreements and, if necessary, get written approval to proceed.
2. Clean the data. It takes time, but you can’t work with corrupt data.
The “ETL” preparation process covers “extracting, transforming and loading” data. Clearing the data takes the most time, but running uncleaned data through an algorithm produces nonsensical results. Data must be in the correct format, with no errors or missing information. It should have no anomalies beyond those researchers usually handle.
Analysts should copy raw data from its original source and format in a language that allows access by a “relational database.” If your data corrupts while loading, reload it. Analysts can correct missing or incorrectly entered data, depending on the field affected. The fields formatted for dates or currency often cause issues. To avoid this problem, use a YYYY-MM-DD format for dates. Remove commas and symbols from currency while retaining two decimal points.
“Data preparation is always going to be time-consuming, but the more due diligence you take in this stage, the more you will speed up the Data Science Process as a whole.”
Correct or remove outliers and anomalies, depending on the specifics of the data set. Visualization tools – such as Notepad++ or EditPad Lite, which are free for personal use – are useful for viewing raw data. Visually check outliers using a bell curve graphic. After loading clean data, make sure the total number of rows matches that number in the initial data set. Check the top and bottom 100 rows for correctness. Check any text, date and balance fields since these are common problem areas.
3. Analyze your data. Select the most suitable type of algorithms.
Analysts can apply a multitude of algorithms to data sets, including “classification, clustering and reinforcement learning.” Depending on the goal of your project, ensure that the algorithm your analysts utilize can handle the data effectively.
When you have historical data or defined data groups, use classification algorithms. These include decision trees for smaller data sets and the “random forest” regression for larger ones. Regression models include simple linear regression, which determines how one variable reacts with another, such as examining a country’s GDP and crime rate. Multiple linear regression allows users to analyze a dependent and two or more variables in complex data sets. For example, a study might explore how identified elements such as age or personality could affect anxiety levels when moving from one home to another.
When you deal with unknown categories, use clustering, which is the opposite of classification. You can use it with data sets of any size, especially when you want to improve targeted marketing, but are unsure what groupings exist.
“If the raw data is not first structured properly in the data set, then the later stages of the process will either not work at all or, even worse, will give…inaccurate predictions and/or incorrect results.”
Artificial intelligence uses reinforcement, such as deploying learning algorithms to help a robot teach itself to walk versus programming it with a defined process. Those models lend themselves to probabilistic analysis using “Thompson sampling,” which randomly selects elements for analysis, but allows batch updates.
Crowdsourcing programs, such as SkinVision, help with certain machine learning algorithms. SkinVision uses an algorithm to analyze a photo and to posit the possibility that a user’s mole has malignant symptoms. It then recommends the next steps the patient should take with a doctor. IBM’s Watson AI system, which use a more advanced algorithm than SkinVision, diagnosed a rare disease in 10 minutes, arriving at a diagnosis that doctors had tried to identify for weeks.
4. Envision your data. Relay information visually to show what your analysis means.
“Data visualization” is the process of creating visual aids to display the content and meaning of your information. Once analysts generate data results, they need to explain the effectiveness of their analysis so their stakeholders can understand it. Several programs help you tell your data’s stories and even create graphics directly from your information.
Your most relevant findings should stand out in your presentation, whether by placement, color or – for qualitative data shown in word clouds – the size of the individual words. You don’t need to include all the information from your analysis, but do include the essential elements.
As you outline your presentation, consider which graphics or media might best explain your ideas and results. If you find more than one interesting result, show it graphically. Limit the amount of text on any page. Using visuals to communicate your message helps you make sure that people will pay attention to you instead of reading the text as you present it. If you are sending in a report rather than presenting it, explain your analysis more fully.
“A color wheel can help you determine what type of color combinations to use based on the number of elements and the data you are presenting…Be aware that color sometimes delivers a certain message; for instance, people may think that green represents profit.”
Charts and graphics can range from line and bar charts to more complex heat maps, tree maps, diagrams or word clouds. Select the kind of graphic that is most effective in relaying the specific type of information you want to communicate.
5. Present your findings. Begin at the start of the analysis process and tell a story.
The ability to present data well separates a good data analyst from a “rockstar data scientist.” Keep the initial question in mind as you rough out your presentation using the Data Science Process. Tell your stakeholders the story beginning with the question you asked and ending with the results you found.
“To create advocates: Don’t guard your secrets like a jealous magician. Go out of your way to show your clients the approach you have taken and how data science can vastly improve their business.” ”
After restating the question or problem, explain how the findings could apply in a practical way, for example, to help increase sales or improve customer experiences. Include any relevant or unexpected areas you found in the data.
Data science offers many career opportunities.
Entering the 2020s, available data science positions will increase by an estimated 364,000 jobs in the United States. These jobs will arise in professional services, finance, insurance, manufacturing, information, health care and retail according to a Burning Glass Technologies/IBM 2017 report. Unlike other areas, which demand expertise, data science allows newcomers with confident skills to begin as consultants and work across multiple industries.
Before you commit to working in any one aspect of data science, investigate different arenas of this fluid discipline. Data scientists leverage data creatively and find the best use for available information. Available data sets, free or trial data analytics software, and a variety of visualization and presentation tools will help you hone your instincts, polish your skills and build up your knowledge.
“In an age where so many jobs are at risk of being made obsolete within 20 years, data science should be an area of interest for anyone looking for job security, let alone an interesting career path.”
You don’t need to spend decades practicing, but you do need to practice. Many free data sets are available for you to use for practice, including the European Union Open Data Portal to the CIA World Factbook or the US National Climatic Data Center. Read books and check out online courses. Due to the speed of technology, be wary of lengthy degree programs that may be obsolete by the time you graduate. Online forums and communities are readily available.
Collected data is valuable, so remain vigilant about security concerns. The 2017 Equifax breach, which affected almost one out of every two people in the United States, demonstrated how fragile security systems can be. Companies need cybersecurity specialists who can work with unstructured data.
If you are going to be interviewed for a data science job, prepare for the interviewer to ask “Fermi questions,” such as, “How many red cars are currently being driven in Australia?” The goal is not to derive a correct answer, but to demonstrate that you can analyze, think logically and calculate valid estimates.
About the Author
Kirill Eremenko, CEO and founder of the online education portal SuperDataScience, provides online courses to more than 300,000 people.
This document is restricted to personal use only.
Comment on this summary